

Governance:
- the traditions and institutions by which authority in a country is exercised, including the process by which governments are selected, monitored and replaced;
- the capacity of the government to effectively formulate and implement sound policies; and
- the respect of citizens and the state for the institutions that govern economic and social interactions among them.
Good governance begins with the political will to govern well, wrote Stellenbosch University’s FC Prinsloo in his 2012 paper Good Governance in South Africa: A Critical Analysis. Power and authority abuse, dishonesty, fraud, and violation of the legal systems are factors causing good governments to fail, Prinsloo wrote.
Furthermore, Prinsloo concluded, only good governance can shrink the huge gap between rich and poor, and create wealth.
Good governance has taken a hard knock in recent years. The Worldwide Governance Indicators (WGI) tell a story of shrinking good governance in South Africa and other nations, through diligent reporting on six broad dimensions of governance for over 200 countries and territories, between 1996 and 2018:
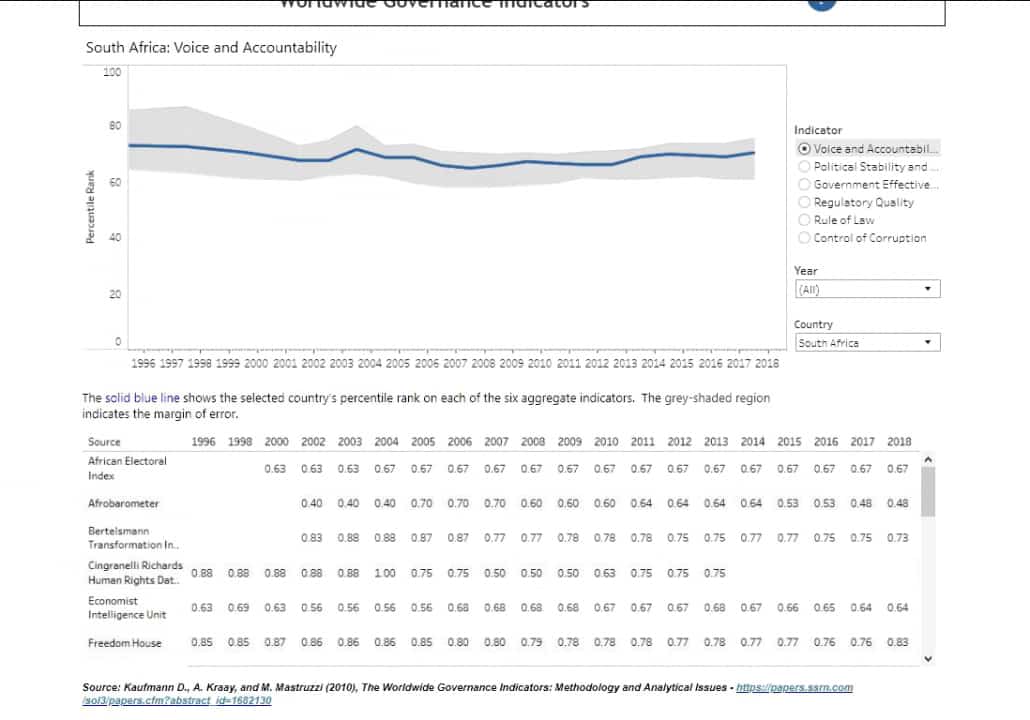
- Voice and accountability – capturing perceptions of the extent to which a country’s citizens are able to participate in selecting their government, as well as freedom of expression, freedom of association, and a free media.
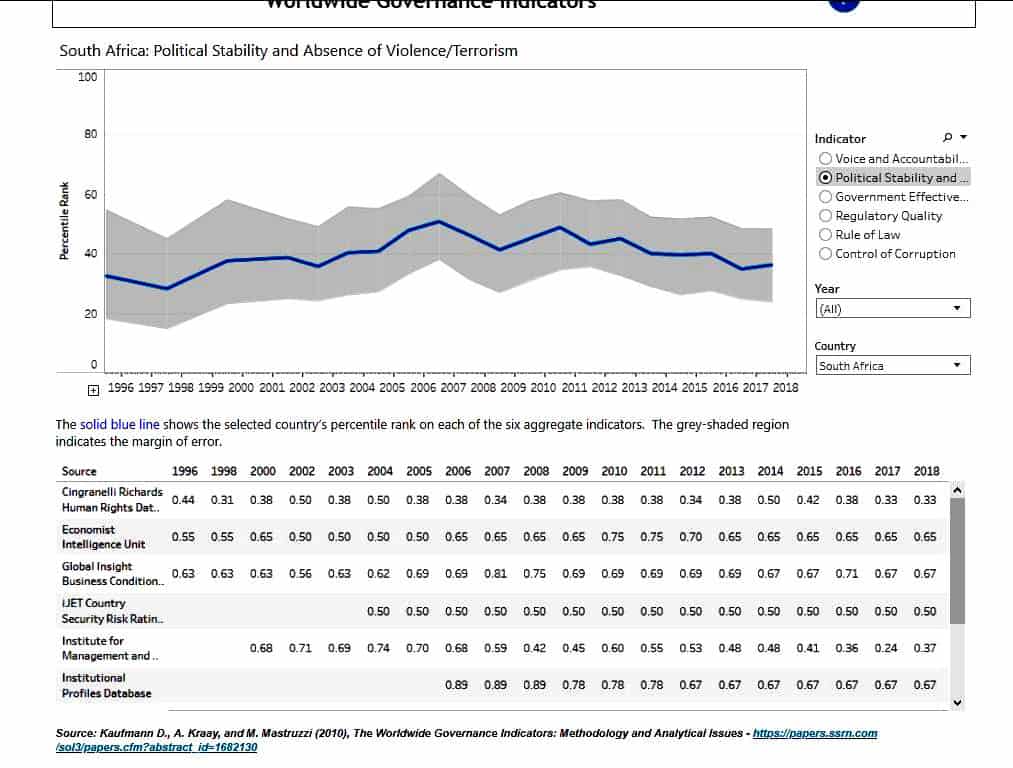
- Political stability and absence of violence – capturing perceptions of the likelihood of political instability and/or politically-motivated violence, including terrorism.
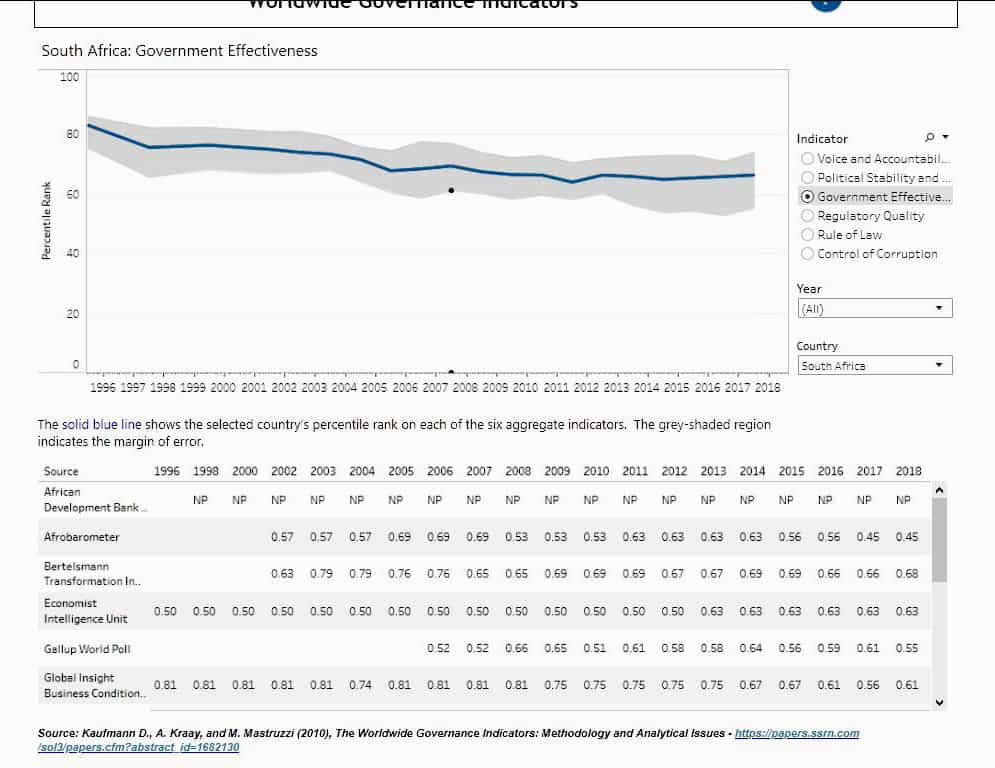
- Government effectiveness – capturing perceptions of the quality of public services, the quality of the civil service and the degree of its independence from political pressures, the quality of policy formulation and implementation, and the credibility of the government’s commitment to such policies.
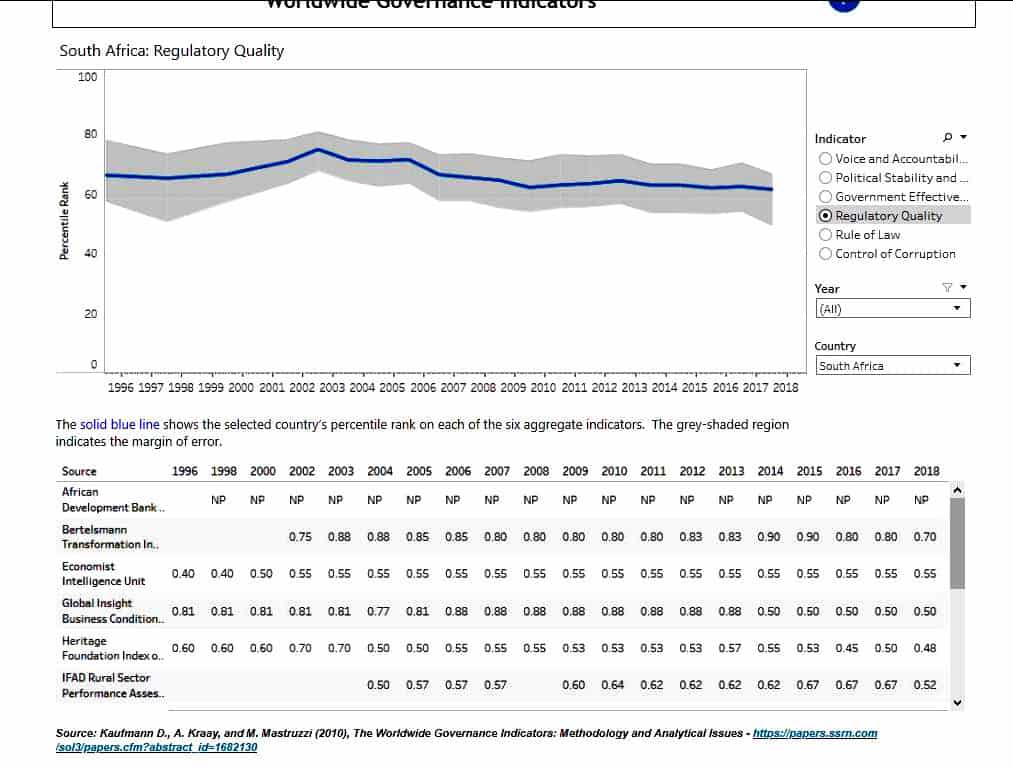
- Regulatory quality – capturing perceptions of the ability of the government to formulate and implement sound policies and regulations that permit and promote private sector development.
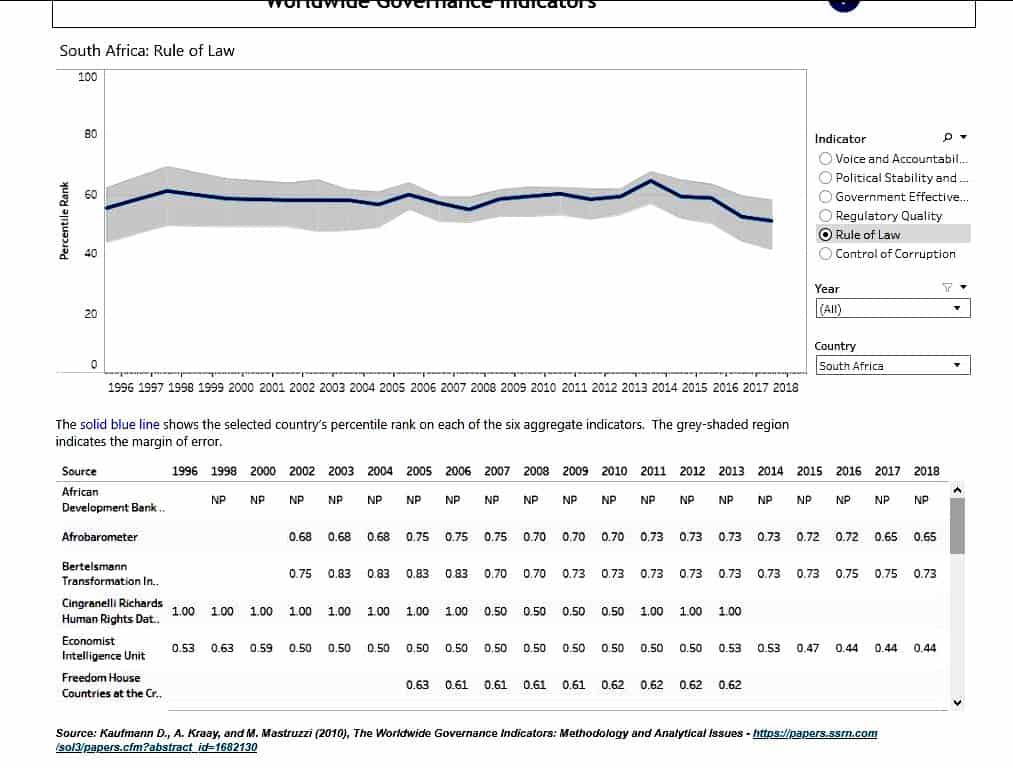
- Rule of law – capturing perceptions of the extent to which agents have confidence in and abide by the rules of society, and in particular the quality of contract enforcement, property rights, the police, and the courts, as well as the likelihood of crime and violence.
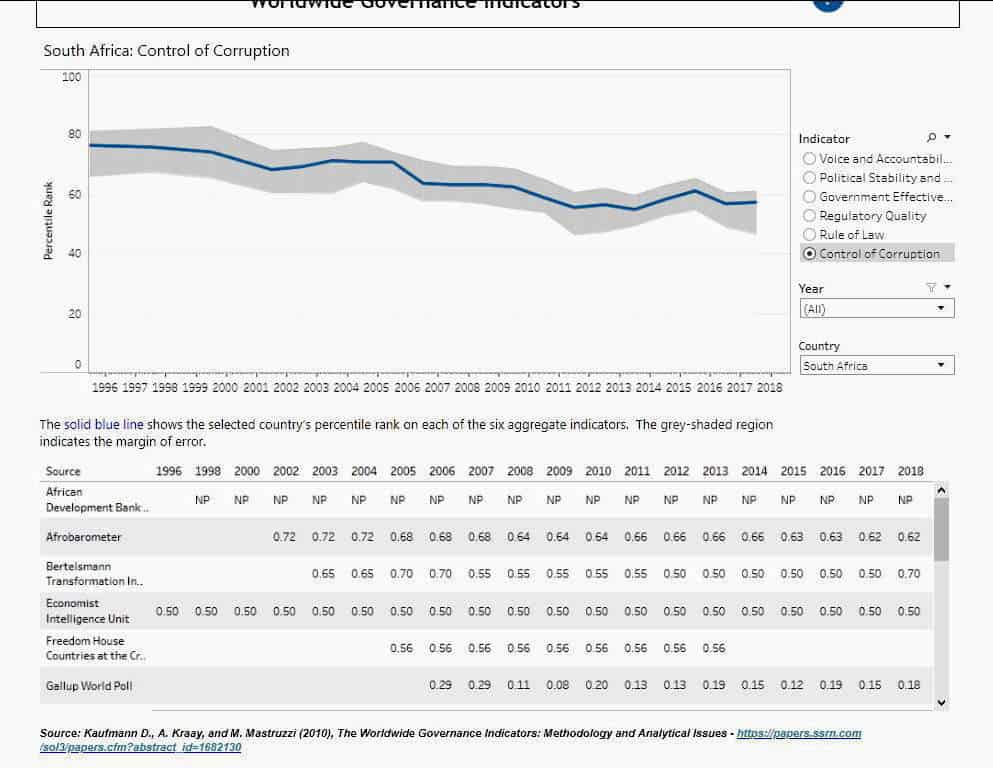
- Control of corruption – capturing perceptions of the extent to which public power is exercised for private gain, including both petty and grand forms of corruption, as well as “capture” of the state by elites and private interests.
One needs only to look at a chart of South Africa’s control of corruption over the 22 years monitored by the WGI, to see the downward spiral. The other five don’t make for impressive viewing either.
Daniel Kaufmann of the Natural Resource Governance Institute (NRGI) and Brookings Institution, and Aart Kraay of the World Bank Development Research Group are responsible for collecting and assembling the datasets. Kaufmann was an early expert witness at the Zondo commission into state capture, testifying in September 2018 that relationships between the captor and the captured were complex and developed over some time.
The WGI are used by policymakers and civil society groups to monitor performance and advocate for governance reform. The WGI are also used by aid donors who recognise that the quality of governance is an important determinant of the success of development programs. Scholars, too, use the indicators in their empirical research on the causes and consequences of good governance.
Scores are presented as percentages from 0 to 100, and are compiled from a large number of underlying data sources, which are presented beneath each visual. Margins of error are shown as a grey area above and below the line graph, corresponding to 90% confidence intervals.
The WGI show that governance can in fact be measured systematically across countries – and this evidence-based approach yields important insights:
- Good governance is not the exclusive preserve of rich countries – in fact over a dozen developing and emerging countries including Slovenia, Chile, Botswana, Estonia, Uruguay, Czech Republic, Hungary, Latvia, Lithuania, Mauritius, and Costa Rica have governance scores better than those of industrialized countries such as Italy or Greece.
- Significant improvements in governance can and do occur even over the relatively short period of a decade. In fact nearly one-third of countries in the WGI show a significant change in at least one of the six aggregate indicators between 1998 and 2008, roughly equally divided between improvements and declines.
- Notions of “Afropessimism” regarding governance are misplaced, with several countries in Africa showing significant improvements in governance over the past decade, including Ghana, Liberia, Rwanda, Angola, Ethiopia, and the Democratic Republic of Congo, although often from a very low base.
South Africa, stuck in the mud
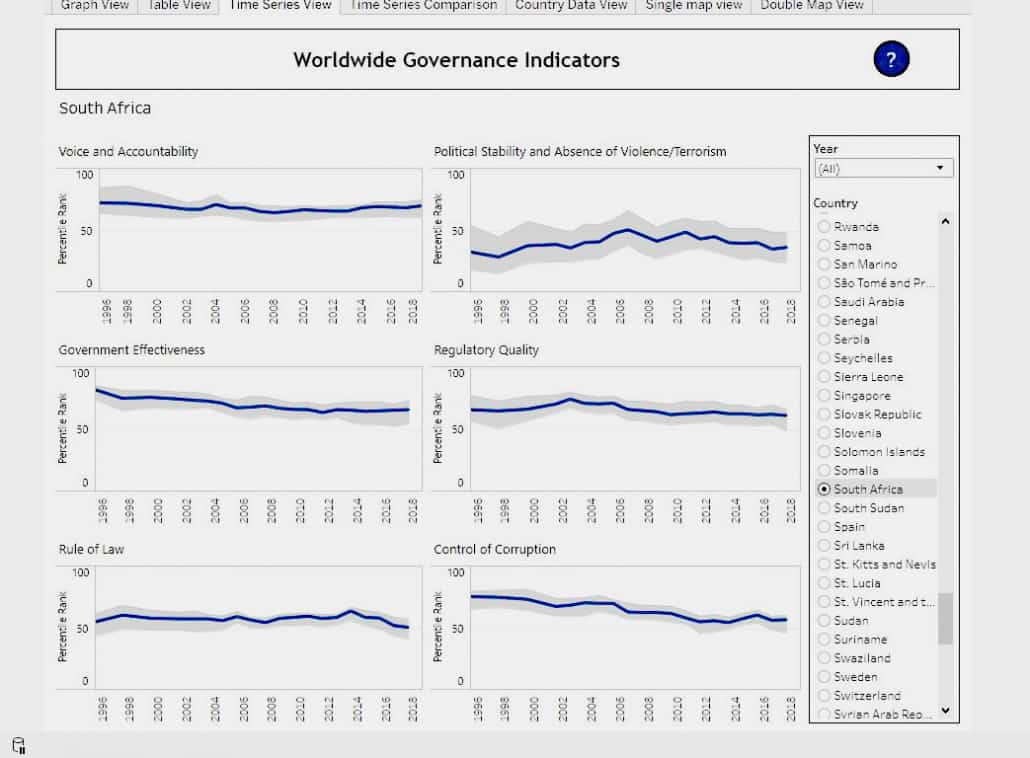
Overall, South Africa has declined, if anything. Several indicators (voice and accountability, regulatory quality, rule of law) have barely moved, showing little improvement or decline. Political stability has inched up by a small margin overall. Government effectiveness has dipped. The one indicator that shows the most marked downward trend is control of corruption.
The tables below give the country’s scores for all indicators and for all years.
This is hardly surprising. In its 2018 publication titled Joining the Dots, Open Secrets shows how corruption events have been interlinked, from the apartheid regime to the current democratic South African government, and everything in between. As with other countries, corruption and economic crime have existed for so long that they have become systemic and hard to root out.
South Africa’s extremely average location around the middle of the Y-axis is concerning. The country has hardly moved for 22 years – only political stability has shown signs of life..
What’s more, the lethargic movement of the indicators show an acceptance of mediocrity. As with the Corruption Perceptions Index published annually by Transparency International, a tiny improvement is no cause to rejoice, for it conveys a readiness to merely hover around a middling position, with no zealous will to improve. South Africa has remained in more or less the same position on the CPI for years, moving up or down by only a percentage point or two.
While the events revealed in the ongoing state capture commission, which held its first hearings in 2018, will not have been captured in time to make a significant impact on the data, the collection of which ended in that year, it is safe to say that not much will have changed in a scant two years.
At the very least, we might consider ourselves lucky that the Zondo and other revelations of the past two years will not be factored in, thereby causing a dramatic downward plunge.
More about WGI
The indicators are compiled from several hundred variables obtained from 31 different data sources, capturing governance perceptions, views and experiences of survey respondents and experts in the public and private sectors, as well as various NGOs, around the world.
These data sources include:
- surveys of households and firms (e.g. Afrobarometer surveys, Gallup World Poll, and Global Competitiveness Report survey)
- NGOs (e.g. Global Integrity, Freedom House, Reporters Without Borders)
- commercial business information providers (e.g. Economist Intelligence Unit, Global Insight, Political Risk Services), and
- public sector organisations (e.g. CPIA assessments of World Bank and regional development banks, the EBRD Transition Report, French Ministry of Finance Institutional Profiles Database).
Due to the inherently unobservable nature of the true level of governance in a country, Kaufmann and Kraay emphasise, any observed empirical measure of governance will only be an imperfect proxy for the broader dimensions of governance that it reflects, and the data informing the WGI are no exception.