|
Getting your Trinity Audio player ready...
|
All calculations are contained in Schedule 1A of the Electoral Act, 73 of 1998
South Africans don’t vote for individuals – they vote for parties who then elect the individuals they think would do the best job in representing the people. The proportion of representation a party has in Parliament is calculated according to a quota derived from the total number of votes cast and the number of seats available, and the number of votes received by that party.
In the South African voting system, registered parties contesting an election of the National Assembly (NA) must nominate their election candidates on lists prepared in accordance with the Electoral Act.
The candidate lists must not contain more names than the number of NA seats, and each list must denote the fixed order of preference of the names.
There are 400 NA seats, which are distributed in two portions, as follows:
- One half of the seats from regional lists submitted by the respective parties. For every election of the NA, the Independent Electoral Commission determines a fixed number of seats reserved for each region, taking into account available scientifically based data in respect of voters and representations by interested parties.
- The other half of the seats from national lists submitted by the respective parties, or from regional lists where national lists were not submitted.
These 400 MPs serve for five years, until the next general election.
According to Schedule 1A of the Electoral Act, the seat calculation is done in the following manner:
- Step 1: Using a quota system (which is explained in the example), each party’s overall allocation of the 400 seats is determined on a proportional basis.
- Step 2: The 200 regional list seats are determined for each region using a quota based on the number of seats allocated to the region.
- Step 3: The 200 national list seats are determined by subtracting the total number of regional seats for a party from the overall allocation for that party.
EXAMPLE
Number of seats available: 400
Registered voters: 26 000 000
Valid votes cast (nationally): 18 600 000
Votes received by parties:
- Party A: 2 398 000
- Party B: 4 965 000
- Party C: 9 800 000
- Party D: 47 000
- Party E: 1 490 000
- Total = 18 700 000
To establish the quota for each party, the total number of votes is divided by the number of seats available. Thus 18.7-million is divided by 400, with an extra seat added on to the divisor (the number that the total is being divided by, in this case 400) and the quotient (the answer we get) (see image 1). The quota figure is the result plus one, and in our example it is 46 634 – which means that to get one seat in Parliament, a party must get at least this number of votes.
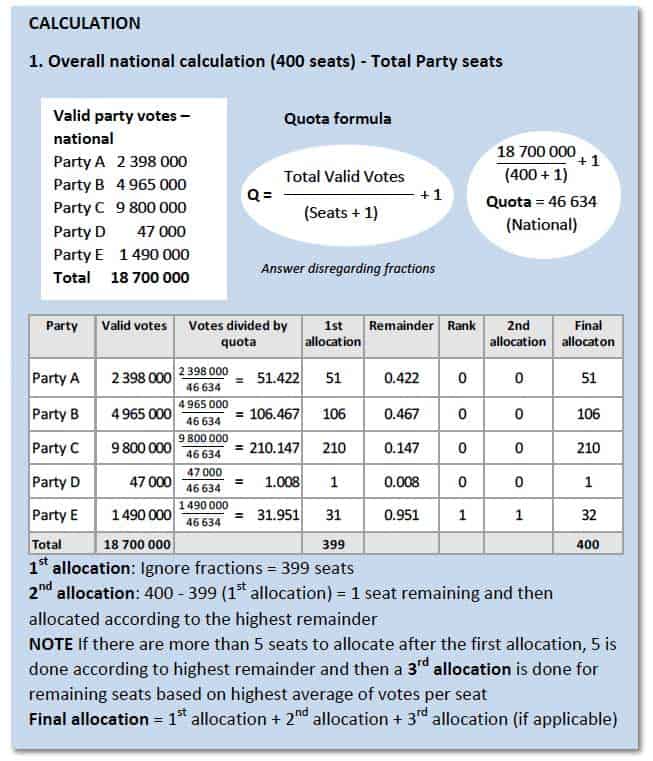
Image 1 Calculating the total number of National Assembly seats per party
The quota figure is further divided into the number of votes received by each party, giving the number of seats that party has won.
In our example above, party D will get only one seat, while Party A will get 51 seats because their number of votes – 2 398 000 – divided by the quota of 46 634 gives us 51.4 (rounded to 51). Party C, meanwhile, will get 210 seats.
This is the first allocation, but there is still one seat left over after doing the calculation, because of the extra seat added to 400 during the division step.
In the second allocation, the final seat goes to the party with the highest remainder after their votes have been divided by the quota. In our example, Party E has the highest remainder, and it gets the last seat.
Regional list seat calculation
The 200 available regional seats are divided up before an election, based on the registered population in each. For example:
- Eastern Cape: 25
- Mpumalanga: 15
- Free State: 11
- North West: 13
- Gauteng: 48
- Northern Cape: 5
- KwaZulu-Natal: 41
- Western Cape: 23
- Limpopo: 19
Using the same model of five main parties, as above, we could expect a result as follows, in Gauteng:
- Party A: 1 350 000
- Party B: 935 000
- Party C: 3 560 000
- Party D: 45 000
- Party E: 490 000
- Total = 6 380 000
The total of 6 380 000 is now divided by the number of regional seats allocated previously to Gauteng – we see above that this is 48. The calculation is performed in the same way as that of the NA seats – dividing the total number of votes by the number of seats, plus one extra added to the number of seats as well as to the result (see image 2). Gauteng’s regional quota will therefore be 130 205.
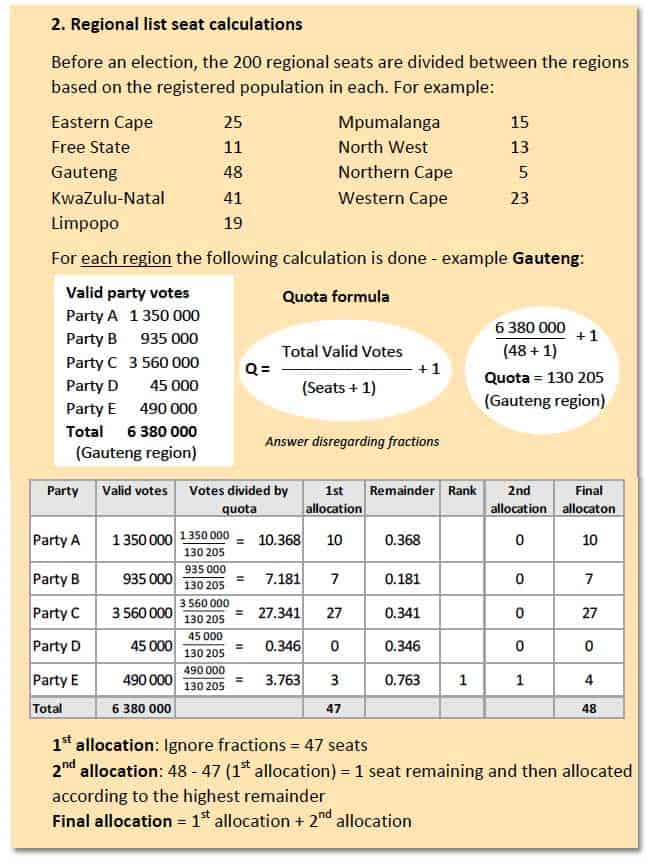
Image 2 Calculating the number of regional seats for each party
A party must get at least their stipulated quota in order to gain one regional parliamentary seat. In this example Party A will be able to place 10 Gauteng MPs while Party C will have an impressive 27 Gauteng MPs in Parliament.
As before, there is one Gauteng seat left over after the calculations are done and dusted. The final seat will go to the party with the highest remainder on the Gauteng votes table – in our example this is Party E yet again.
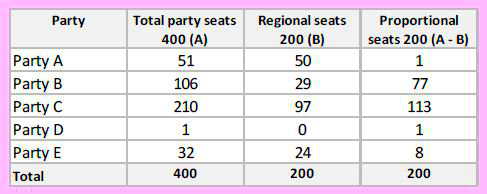
National list seats
National
list seats are calculated by subtracting all the regional list seats for a
party from the total party seats for that party.
Provincial legislatures
The number of seats per province are detailed below in image 4:
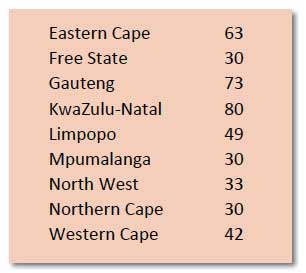
Calculations for the provincial legislatures follows the same process as the regional calculations, only using the respective provincial legislature seats allocated.
Graphics from the Independent Electoral Commission


