|
Getting your Trinity Audio player ready...
|
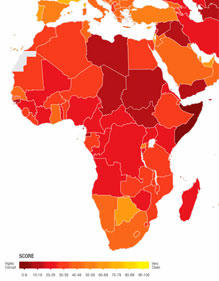 Transparency International (TI) has launched its annual corruption perceptions index, and South Africa has not improved noticeably on its score of 43 and ranking of 69 for 2012. Last year the country dropped two places on the sub-Saharan Africa rankings, from seven to nine, and this year it drops another place to 10.
The index ranks 177 countries on a scale from 100, which is very clean, to 0, meaning the country is highly corrupt. According to TI, 70% of the 177 countries scored below 50.
South Africa falls somewhere in the middle. Its rank for this year is joint 72nd with a score of 42, meaning that it’s perceived to be somewhat more corrupt than not. The global average is 43.
“Our ranking and score are far from satisfactory but we take some comfort from the fact that our position seems to be stabilising,” said Corruption Watch’s executive director David Lewis. “However, there is certainly no room for complacency. The TI survey is establishing, once again, that perceptions of corruption remain very strong.”
South Africa’s almost unchanged index scores can be attributed to the level of outrage expressed by the public in the form of service delivery protests and eagerness to report corruption to independent civil society-based organisations like Corruption Watch.
Where does South Africa fit in?
South Africa is 10th on the list of African countries, and in the continental context would seem to be placed quite well, with 43 countries lagging behind. However, the country’s score is nothing to be proud of – in the global context it’s merely average, and there is still much work to be done to root out corruption at all levels of government.
“The challenge is now to turn corruption around,” said Lewis. “There are some signs of determined action to combat corruption in the public sector. For example, the anticorruption measures that the Department of Public Service and Administration is attempting to put in place are commendable.”
But the impact of these actions is diminished by the continuing impunity on the part of those who were politically and financially powerful, he added.
The African context of corruption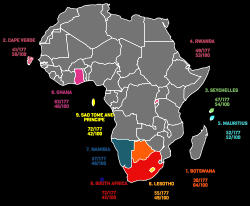
The least corrupt countries in Africa, says the CPI, are perceived to be Botswana, ranked 30 with a respectable 64, Cape Verde at 41 with a score of 58, and 49th-placed Rwanda, with a score of 53. Rwanda came in just ahead of Mauritius, at 52 for both score and rank.
Botswana is also Africa’s least corrupt country according to the Positive Peace Index, an initiative of the non-profit Institute for Economics and Peace. This tool ranks countries based on the strength of the structures and social institutions that contribute to a peaceful society – such as a well-functioning government, an equitable distribution of resources, the free flow of information, and low levels of corruption.
One of the reasons for Botswana’s continuing success at keeping major corruption at bay, lies in the fact that it effectively enforces ethics for all public servants, and top government officials are required to disclose income and assets and are not immune from prosecution. South Africa, too, has these requirements, but they don’t seem to be implemented as effectively.
People shunning corrupt activities
In TI’s global corruption barometer (GCB) for 2013, released in early July, the least corrupt country in Africa was Rwanda. Here the number of people who paid a bribe for government services was low, at most 23% (to the police). In South Africa 36% had paid a bribe to the police, and the highest figure was the 39% who bribed the registry and permit services.
Rwandans who felt that public institutions were corrupt were also few – the highest percentage was the 21% who felt the police were corrupt, compared to South Africa’s 83%. Only 3% of Rwandans disagreed that ordinary people can make a difference in the fight against corruption – in South Africa it was 32% of naysayers.
Commenting on the 2013 GCB, Rwanda’s minister of local government, James Musoni, attributed the decrease of corruption in the country to mechanisms such as a transparent, accountable and good governance system, and institutions and committees fighting corruption at different levels. He also said that citizens were behind the efforts to eliminate corruption, and without their full backing no effort could succeed.
Botswana, Cape Verde and Mauritius didn’t feature in the GCB, but a recent Afrobarometer survey polled Botswana citizens on their views of corruption in the country – 32% thought either all or most of the officials in non-local government and those with jobs as civil servants were involved with corruption, while 29% held the same view of members of parliament. Local government was perceived as less corrupt with just 20% saying either all or most of the officials in local government were involved with corruption.
Most respondents also said that they had never bribed a public official – only 2% or 3% in the appropriate categories such as housing, electricity or seeking employment, had been involved in bribery.
TI’s corruption information on Mauritius indicates that the country scores 0.68 in terms of control of corruption, with global estimates ranging from around -2.5 to 2.5. Higher values, says TI, correspond to better governance outcomes. South Africa scores 0.09 in this category, while Botswana scores 0.97, Cape Verde scores 0.77 and Rwanda scores 0.48.
On the Financial Secrecy Index, which identifies and ranks jurisdictions according to their level of financial secrecy, Mauritius scores 74 and ranks 32. The higher the secrecy score, the more secretive the jurisdiction, says TI. There is no figure for South Africa on this index, and the only other top-ranking African country represented is Botswana, with a score of 79 and a rank of 49.

